Showing posts with label .NET4.0. Show all posts
Thursday, May 19, 2011

Insert with Dapper Micro ORM and ASP.NET MVC 3

As I have already posted about the how to fetch data in my earlier post for Dapper ORM. In this post I am going to explain how we can insert data with the dapper ORM. So let’s extend the earlier post project. As explained in earlier post I have already created a class called CustomerDB this class will contains all the operation with Dapper Micro ORM. So For inserting data let’s first create CREATE method like following in CutomerDB Class like following. In that I have create a simple Insert Query in string and then using connection.execute method to execute method. Following is code for that.
public class CustomerDB
{
  public string Connectionstring = @"Data Source=DotNetJalps\SQLExpress;Initial Catalog=CodeBase;Integrated Security=True";

  public IEnumerable<Customer> GetCustomers()
  {
      using (System.Data.SqlClient.SqlConnection sqlConnection = new System.Data.SqlClient.SqlConnection(Connectionstring))
      {
          sqlConnection.Open();
          var customer = sqlConnection.Query<Customer>("Select * from Customer");
          return customer;

      }
  }

   
  public string  Create(Customer customerEntity)
  {
      try
      {
          using (System.Data.SqlClient.SqlConnection sqlConnection = new System.Data.SqlClient.SqlConnection(Connectionstring))
          {
              sqlConnection.Open();
           
              string sqlQuery = "INSERT INTO [dbo].[Customer]([FirstName],[LastName],[Address],[City]) VALUES (@FirstName,@LastName,@Address,@City)";
              sqlConnection.Execute(sqlQuery,
                                    new
                                        {
                                            customerEntity.FirstName,
                                            customerEntity.LastName,
                                            customerEntity.Address,
                                            customerEntity.City
                                        });

              sqlConnection.Execute(sqlQuery);
              sqlConnection.Close();

          }
          return "Created";
      }
      catch (Exception ex)
      {
          return ex.Message;
      }

  }

}
Now we are ready with Create Method for database now let’s create two ActionResult for the Creating customer like following in Customer Controller like following.
public ActionResult Create()
{
return View();
}

//
// POST: /Customer/Create

[HttpPost]
public ActionResult Create(Customer customer)
{
try
{
    // TODO: Add insert logic here
    var customerEntities = new CustomerDB();
    customerEntities.Create(customer);
    return RedirectToAction("Index");
}
catch
{
    return View();
}
}
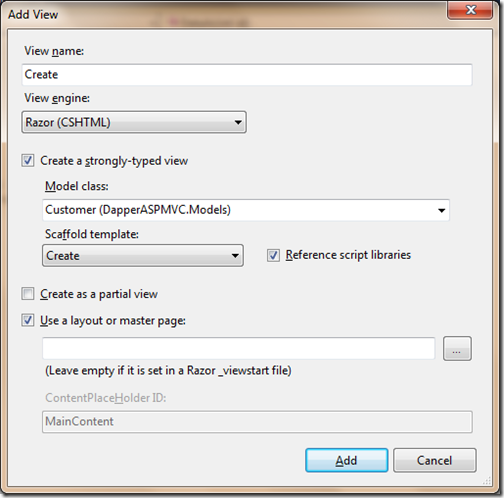
Now we are ready with the both ActionResult. First ActionResult will return simple view of Create which we are going to create now and another ActionResult Create will get customer object from the form submitted and will call our create method of CustomerDB Class. Now it’s time to create a view for adding customer. Right Click return view Statement in Create Action Result and Click Add View and Just Create view like following.

CreateView
That’s it now we are ready. Now let’s test it in browser. Like following.
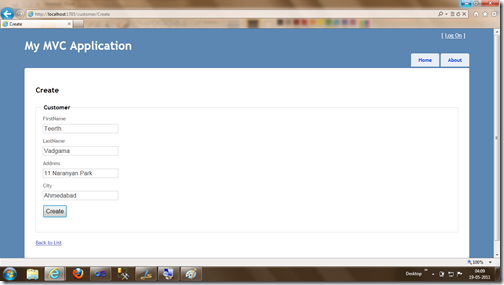
AddNew
Now let’s click and create and then it will redirect us to customer list page like following. Where you can see the newly added details.
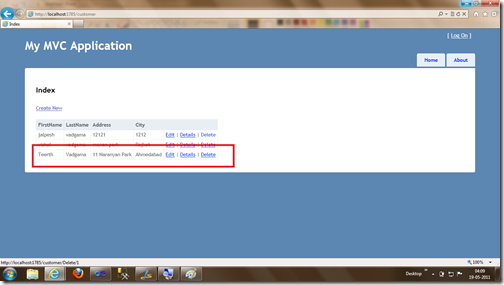
View
So that’s it. Its very easy to Insert data with Dapper Micro ORM. Hope you like it…Stat tuned for more.

Note: For reference of this post you can also see my first post called -Playing with dapper Micro ORM and ASP.NET MVC 3.0.
kick it on DotNetKicks.com
Shout it
Share:
Friday, May 13, 2011

HTML5 Intellisense in Visual Studio 2010/2008

Recently I was playing with HTML5 and I was in need of the HTML5 intellisense in Visual Studio 2010. I found a great extension which will provide me a great intellisense for HTML5. I thought its great to share with you all.  You can download that tool from following link.

http://visualstudiogallery.msdn.microsoft.com/d771cbc8-d60a-40b0-a1d8-f19fc393127d

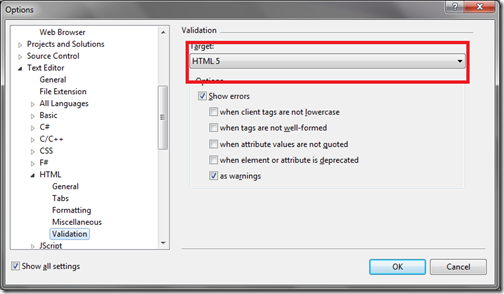
Once you download install it. You need to change your validation to HTML5 in your Visual Studio 2010 configuration. For that you have to go to Tools->Options->Text Editor->HTML->Validation and there you need to select the HTML5 like following.

ToolsForVisualStudio2010

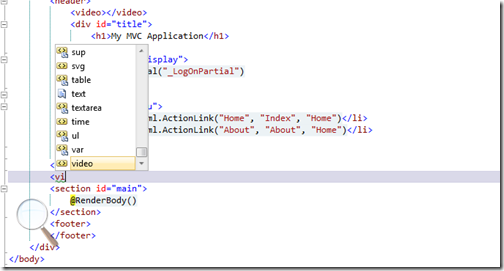
That’s it now your visual studio 2010 or 2008 will have intellisense for HTM5. Just like following.

Intellisense

That’s it. Hope you like it. Stay tuned for more..Happy programming.

Shout it

kick it on DotNetKicks.com
Share:
Saturday, May 7, 2011

Task list window in Visual Studio 2010

Task list is a great feature of visual studio and I think its most unappreciated features of Visual Studio 2010 and most of developers are not aware of it or don’t know about it and that’s why they are not using it. So I decided to write blog post about it.

As .NET Developer we spend lots of time writing code with Microsoft Visual Studio and sometimes we need to write comments for future reference like for debugging we need to some code undone or we need to write some code in future at that time this Task List feature of Microsoft Visual Studio comes very handy .

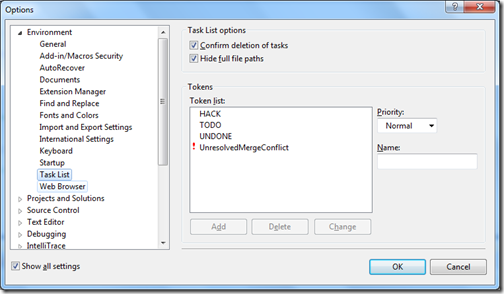
Let’s first see how we can configure Task List Window in Visual Studio to help us better in coding. You can configure Task List window options via Tools-> options then go to Environment and then click Task list then a window will appear like following.

TaskList1

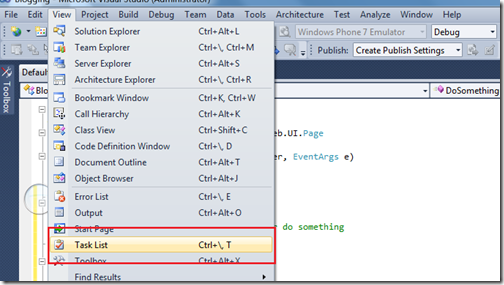
Here you can see the Standard Token of Visual Studio Also you can add your own Tokens also..You can see task list window via View-> Task List window like following. or you can use short cut like Ctrl +\,T.

TaskList2

and Task list window will appear like below.

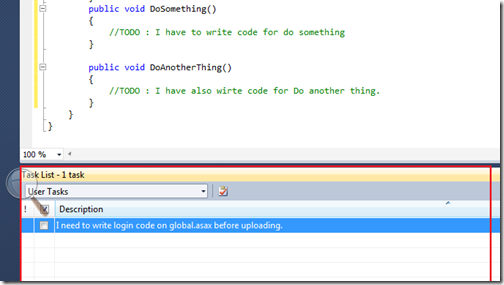
TaskList3

Task list windows show two kind of task list one 1) User Task 2) Token Comments.
User Task are like general comment or general task that developer need to remember during development of project. You can see the the in above picture I have added one task for login code.

As we already know we can configure various token comments via configuration area and that comments will listed in Task list window. Let’s write some like below which contains TODO Token and then we will list that stuff with Task list Window.

using System;
using System.Collections.Generic;
using System.Linq;
using System.Web;
using System.Web.UI;
using System.Web.UI.WebControls;

namespace Blogging
{
public partial class _Default : System.Web.UI.Page
{
    protected void Page_Load(object sender, EventArgs e)
    {

    }
    public void DoSomething()
    {
        //TODO : I have to write code for do something
    }

    public void DoAnotherThing()
    {
        //TODO : I have also wirte code for Do another thing.
    }
}
}
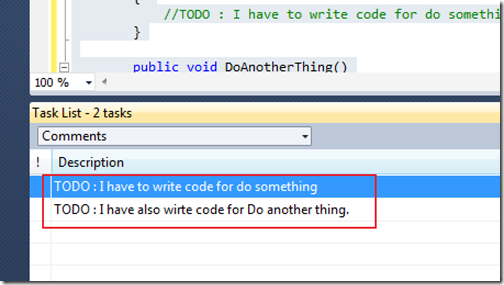
As you can see in above code there are two TODO events and let’s see how it it list in task list windows so let’s open task list window and select comments from dropdown and here you go its appearing in TaskList window as following.

Tasklist4

That’s it. You can see Task list window is making developers life more easy. Hope you liked it. Stay tuned for more.

Shout it

kick it on DotNetKicks.com
Share:
Wednesday, April 13, 2011

Variable Reference Code Highlighting and Hide selection features of Visual Studio 2010.

Microsoft Visual studio 2010 is a Great IDE(Integrated Development Environment) and I am exploring everyday something new in this blog post , I am also going to explore something new with Visual Studio 2010. There are two more new features that can make developers life easier. Let’s explore that in detail.

Variable Reference Code Highlighting

It’s a new feature there in Visual studio 2010. Whenever you put the cursor on the variable it will highlight all the code where that variable used. This is a very nice features as within one shot we can see what is done with that variable in code just like following.

VariableRefeferene

Hiding selected code in Visual Studio 2010

In earlier version of Microsoft Visual Studio We can collapse the method and region. But you can not collapse the particular code block but with Visual Studio 2010 code you can hide the particular selected code via right click outlining –>Hide Selection and you can highlight code lets see first following code.
using System;
using System.Collections.Generic;
using System.Linq;
using System.Web;
using System.Web.UI;
using System.Web.UI.WebControls;

namespace Blogging
{
 public partial class _Default : System.Web.UI.Page
 {
     protected void Page_Load(object sender, EventArgs e)
     {
         if (Page.IsPostBack)
         {
             Response.Write("Page is not postback");
         }

         for (int i = 1; i <= 20; i++)
         {
             Response.Write(i.ToString());
         }
     }
 }
}

Now I want to hide the following Page.IsPostBack part via right click Outlining –> Hide Selection

CodeHiding

As you can see in above image there is –(Minus) Icon so you can collapse that code Just like region. Now you want to undo the collapsing then once again you need to select the code in editor and then right click and then select Outlining->Stop Hiding Current and then it will be treated as normal code with out collapsible block Like below.

UndoSelection

That’s it hope you liked it.. Stay tuned for more.. Happy programming..

Shout it

kick it on DotNetKicks.com
Share:
Monday, April 11, 2011

New search feature Navigate To in Visual Studio 2010

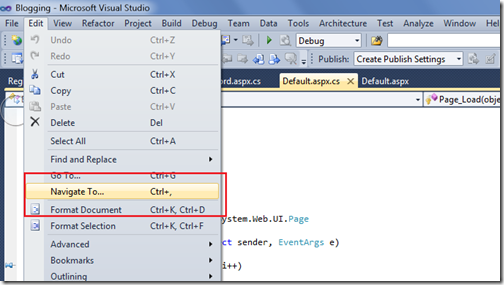
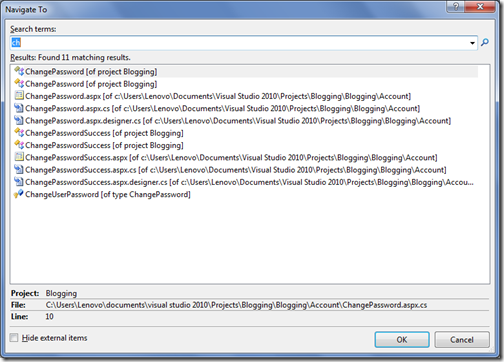
While you are doing code review then it is very necessary to search code and navigate code what you are reviewing and Navigate To feature of Visual Studio 2010 is made for the same. With the help of that feature you can easily navigate through code. You can go to Navigate Window via Edit-> Navigate To or you can directly apply Ctrl + , like following.

NavigateTo

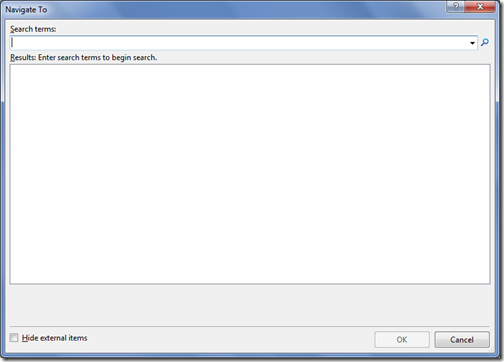
After clicking on Navigate Too a window will open like following.

NavigateToWindow

Now you can navigate to any code with this window like following.It’s a incremental search so once you started typing it will automatically filter it self.

NavigateToSearch

So If you know the method name and anything related to project then it very easy to search with this feature. Hope you liked it. Stay tuned for more.. Happy Programming.

Shout it

kick it on DotNetKicks.com
Share:
Sunday, April 10, 2011

Pin features while debugging in Visual Studio 2010.

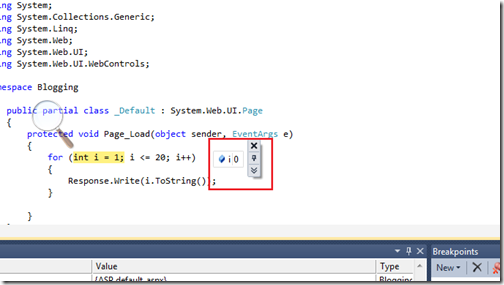
Visual Studio 2010 is one of most awesome tool to debug Microsoft.NET related code. I have found one more interesting feature with the Visual studio 2010. That is called Pin Data Tip feature. This features can be very useful when you are debugging the code with loops. Normally when you debug with the code if you want to know the value of variable then you have to put your cursor on that variable and tool tip will show the values of that variable. The pin feature will pin that tool tip and you don’t have to put mouse over there. Let’s take a simple example to examine that feature. Below is the code for that. I have created a simple for loop and I am printing variable value with Response.Write on asp.net page. Below is the code for that.

using System;
using System.Collections.Generic;
using System.Linq;
using System.Web;
using System.Web.UI;
using System.Web.UI.WebControls;

namespace Blogging
{
  public partial class _Default : System.Web.UI.Page
  {
      protected void Page_Load(object sender, EventArgs e)
      {
          for (int i = 1; i <= 20; i++)
          {
              Response.Write(i.ToString());
          }
       
      }
  }
}

Now let’s put the break point on for loop like following and then start debugging via pressing F5.

BreakPoint

Now I have started debugging and first time code execution came to my break point. Now you can see when I put mouse pointer to that value it will show a variable I value like following.

VaraibleValue

Now as you can see there is one Icon in above code so once you click on that pin Icon that it will pin the DataTip for that variable like following.

Pindatatip

So now whatever you debug in that loop you can see the the value of variable I at any time like following.

VaraibleValue

So that’s it. Now life become easy with this kind of new debugging features of visual studio 2010. Hope you liked it.. Stay tuned for more.. Happy Programming.

Shout it

kick it on DotNetKicks.com
Share:

View Call Hierarchy window in Visual Studio 2010

Visual studio 2010 Ultimate is great IDE(Integrated Development Environment) and I am loving more and more whenever I found some thing new. While doing some Code and Review and other stuff with Visual Studio 2010 I have found one of most interesting feature in Visual Studio 2010 called “Called Hierarchy”.You can navigate your code better with the Call Hierarchy feature in Visual Studio 2010.
To check out let’s Create a sample asp.net MVC application like following .

CallHirerchay

After creating a ASP.NET MVC 2 application it will create a basic simple application and we can run it and We have two views like home and about. We will check few code with Call Hirarchy. We can enable Call hierarchy window with two way one from the View->View Call Hierarchy like following or you can also use the shortcut Ctrl+Alt+K.

CallHirerarchywindow 

Now lets check the Account Controller-> Logon Action Result with call hierarchy You can also enable call hierarchy with selecting the Logon action and right click –> View Call Hierarchy like following or You can use the Shortcut for that like Ctrl + K,Ctrl + T.

ViewCallHierarchy 

Once you click the call Hierarchy It will open the code that is called logon and also call made from the logon method like below.

CallHierarchayforLogin

One you expand the both ‘Call To LogOn’ and ‘Calls from LogOn’ you can see all the calls Since there is no call for Logon on asp.net mvc sample application it will say but you can see calls made from it like following.

DetailOfCall

And on double click on any method or property will navigate you that code. Like I have double clicked the IsNullOrEmpty I have navigated to string class with that property.

StringIsnullOrEmpty

That’s it. So you can see its a great way to navigate code for code review and code inspection. Hope you liked it.. Stay tuned for more.. Happy Programming..

Shout it

kick it on DotNetKicks.com
Share:
Saturday, April 9, 2011

Adding labels to breakpoint in visual studio 2010

With visual studio 2010 Microsoft has given a new features called to add/edit label in break point. This features comes very handy when you are having very large code to debug and You are having so many break points to debug. So, You can add the label to various break point and then use this label to understand execution of program. Let’s see how its works with visual studio 2010.

I have written following sample code to understand it better. This is a simple default.aspx page with four method to print a string on web page.

using System;
using System.Collections.Generic;
using System.Linq;
using System.Web;
using System.Web.UI;
using System.Web.UI.WebControls;

namespace Blogging
{
  public partial class _Default : System.Web.UI.Page
  {
      protected void Page_Load(object sender, EventArgs e)
      {
          Method1();
          Method2();
          Method3();
          Method4();
       
      }

      public void Method1()
      {
          Response.Write("Method1");
      }
      public void Method2()
      {
          Response.Write("Method2");
      }
      public void Method3()
      {
          Response.Write("Method4");
      }
      public void Method4()
      {
          Response.Write("Method4");
      }
  }
}

Here you can see there are four methods method 1,2,3 and 4 and each printing respective string with respective methods.

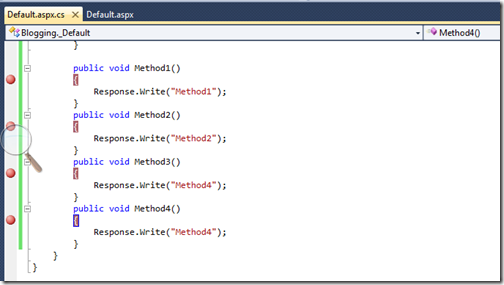
Now Let’s put four break point in visual studio like following.

Four breakpoints with four methods

Now let’s debug the web application via pressing F5 and then we will go one by one break point and will add labels. Now I am at first break point.

FirstBreakPoint

Now when you go to the break point window you can see all the break point over there like following.

BreakPointWindow

Now let’s Create a new label first for break point via selecting that row and right click edit label like following.

Edit Labels

Once you click edit labels a window will appear which will ask for adding a new label for break point like following.

AddLabel

Now I am adding a new label called method1 label in this box.Now you can see the in break point window with a label just like following.

Method1Label

So now you can see the Method 1 Label is there so you need not to check this break point via clicking on that break point. You can remember this break point via clicking on this. That’s it. Hope you like it.. Stay tuned for more.. Happy Programming.

Shout it

kick it on DotNetKicks.com
Share:
Friday, April 8, 2011

Historical Debugging (Intellitrace) on Visual Studio 2010 Ultimate Part-2

In the first post I have explained how historical debugging will going to work and how we can enable the historical debugging. In this blog post I am going to take one real time scenario and then we will see the How historical debugging will work. Here I have selected the second option for Intellitrace - Track event and call Information. I am going to check historical debugging with my asp.net application so following is a simple code for that.

using System;
using System.Collections.Generic;
using System.Linq;
using System.Web;
using System.Web.UI;
using System.Web.UI.WebControls;

namespace Blogging
{
 public partial class _Default : System.Web.UI.Page
 {
     protected void Page_Load(object sender, EventArgs e)
     {
         Response.Write("This is a page load event");
         ThrowHistoricalException();
     
     }
     public void ThrowHistoricalException()
     {
         throw new Exception("Historical Deubgging");
     }

 }
}

In above code you can see its very simple We are printing one statement on in page load event with Response.Write and then it will call a new method called ThrowHistoricalDebugging. Where it will throw a new exception. Now all ready to check let press F5 to debug this thing. I have putted the break point over Response.Write statement so We can trace everything.  so now debugging starts at my break point Just like below

HistoricalDebuggingBreakPoint

Now let’ proceed the things further now lets step in with the pressing F10 It will call ThrowHistoricalException and Here you can see the exception like following.

HistoricalDebuggingException

As You can see now the Exception thrown. Now lets move to IntelliTrace window what’s are information there.

IntelliTraceWindow

As you can see whole event and method trace information here in Intellitrace windows. Also you can see the A reviwnd Icon there so on clicking on that you can got the specific events and restart debugging. Now I have clicked on Page_load event and Now its going to the page_load event statement where the exception is thrown. Just like below.

IntellitraceRewind

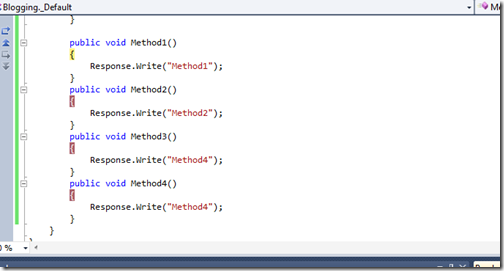
Also you can see there button given to move updown and other stuff to move your current point up and down. I have click move up and You can see in below image its moving up.

IntelliTraceUp

That’s it. As you can see its very easy to move up down and go back to location of code wherever you want with historical debugging. So now you can easily see what happens when your tester is reproducing the bugs. Hope you like it. Stay tuned for more.. Happy Programming.

Shout it

kick it on DotNetKicks.com
Share:

Support this blog-Buy me a coffee

Buy me a coffeeBuy me a coffee
Search This Blog
Subscribe to my blog


My Mvp Profile
Follow us on facebook
Blog Archive
Total Pageviews