Monday, April 11, 2011

New search feature Navigate To in Visual Studio 2010

While you are doing code review then it is very necessary to search code and navigate code what you are reviewing and Navigate To feature of Visual Studio 2010 is made for the same. With the help of that feature you can easily navigate through code. You can go to Navigate Window via Edit-> Navigate To or you can directly apply Ctrl + , like following.
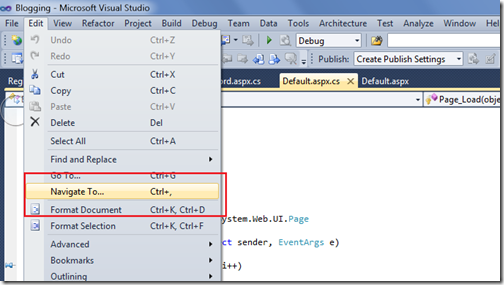
NavigateTo

After clicking on Navigate Too a window will open like following.
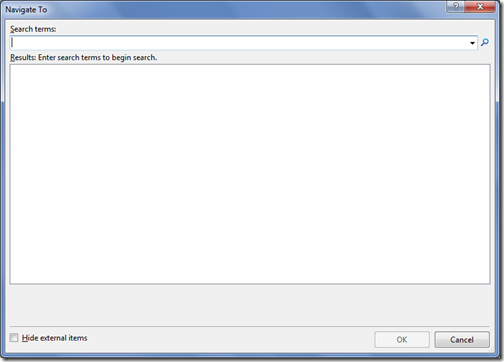
NavigateToWindow

Now you can navigate to any code with this window like following.It’s a incremental search so once you started typing it will automatically filter it self.
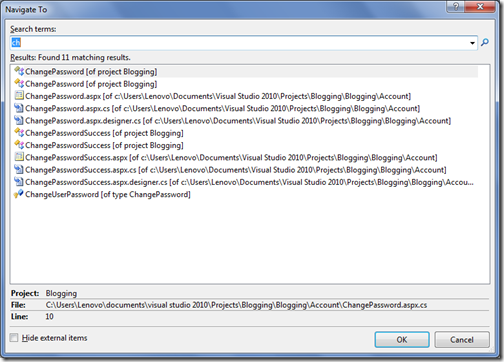
NavigateToSearch

So If you know the method name and anything related to project then it very easy to search with this feature. Hope you liked it. Stay tuned for more.. Happy Programming.

Shout it

kick it on DotNetKicks.com
Share:
Sunday, April 10, 2011

Pin features while debugging in Visual Studio 2010.

Visual Studio 2010 is one of most awesome tool to debug Microsoft.NET related code. I have found one more interesting feature with the Visual studio 2010. That is called Pin Data Tip feature. This features can be very useful when you are debugging the code with loops. Normally when you debug with the code if you want to know the value of variable then you have to put your cursor on that variable and tool tip will show the values of that variable. The pin feature will pin that tool tip and you don’t have to put mouse over there. Let’s take a simple example to examine that feature. Below is the code for that. I have created a simple for loop and I am printing variable value with Response.Write on asp.net page. Below is the code for that.

using System;
using System.Collections.Generic;
using System.Linq;
using System.Web;
using System.Web.UI;
using System.Web.UI.WebControls;

namespace Blogging
{
  public partial class _Default : System.Web.UI.Page
  {
      protected void Page_Load(object sender, EventArgs e)
      {
          for (int i = 1; i <= 20; i++)
          {
              Response.Write(i.ToString());
          }
       
      }
  }
}

Now let’s put the break point on for loop like following and then start debugging via pressing F5.

BreakPoint

Now I have started debugging and first time code execution came to my break point. Now you can see when I put mouse pointer to that value it will show a variable I value like following.

VaraibleValue

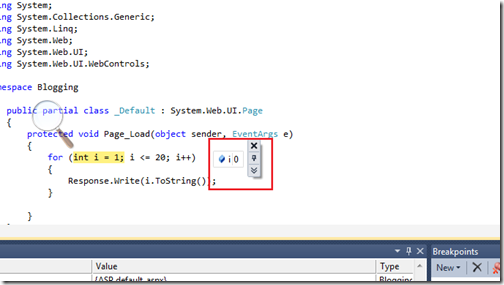
Now as you can see there is one Icon in above code so once you click on that pin Icon that it will pin the DataTip for that variable like following.

Pindatatip

So now whatever you debug in that loop you can see the the value of variable I at any time like following.

VaraibleValue

So that’s it. Now life become easy with this kind of new debugging features of visual studio 2010. Hope you liked it.. Stay tuned for more.. Happy Programming.

Shout it

kick it on DotNetKicks.com
Share:

View Call Hierarchy window in Visual Studio 2010

Visual studio 2010 Ultimate is great IDE(Integrated Development Environment) and I am loving more and more whenever I found some thing new. While doing some Code and Review and other stuff with Visual Studio 2010 I have found one of most interesting feature in Visual Studio 2010 called “Called Hierarchy”.You can navigate your code better with the Call Hierarchy feature in Visual Studio 2010.
To check out let’s Create a sample asp.net MVC application like following .

CallHirerchay

After creating a ASP.NET MVC 2 application it will create a basic simple application and we can run it and We have two views like home and about. We will check few code with Call Hirarchy. We can enable Call hierarchy window with two way one from the View->View Call Hierarchy like following or you can also use the shortcut Ctrl+Alt+K.

CallHirerarchywindow 

Now lets check the Account Controller-> Logon Action Result with call hierarchy You can also enable call hierarchy with selecting the Logon action and right click –> View Call Hierarchy like following or You can use the Shortcut for that like Ctrl + K,Ctrl + T.

ViewCallHierarchy 

Once you click the call Hierarchy It will open the code that is called logon and also call made from the logon method like below.

CallHierarchayforLogin

One you expand the both ‘Call To LogOn’ and ‘Calls from LogOn’ you can see all the calls Since there is no call for Logon on asp.net mvc sample application it will say but you can see calls made from it like following.

DetailOfCall

And on double click on any method or property will navigate you that code. Like I have double clicked the IsNullOrEmpty I have navigated to string class with that property.

StringIsnullOrEmpty

That’s it. So you can see its a great way to navigate code for code review and code inspection. Hope you liked it.. Stay tuned for more.. Happy Programming..

Shout it

kick it on DotNetKicks.com
Share:

Support this blog-Buy me a coffee

Buy me a coffeeBuy me a coffee
Search This Blog
Subscribe to my blog


My Mvp Profile
Follow us on facebook
Blog Archive
Total Pageviews