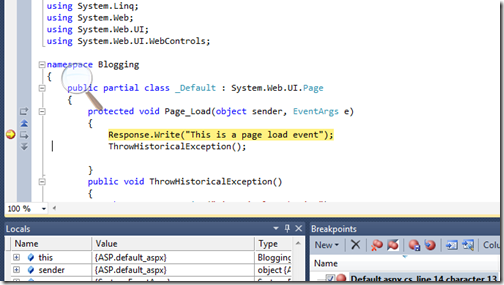
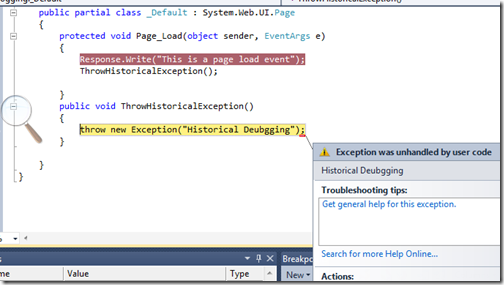
With visual studio 2010 Microsoft has given a new features called to add/edit label in break point. This features comes very handy when you are having very large code to debug and You are having so many break points to debug. So, You can add the label to various break point and then use this label to understand execution of program. Let’s see how its works with visual studio 2010.
I have written following sample code to understand it better. This is a simple default.aspx page with four method to print a string on web page.
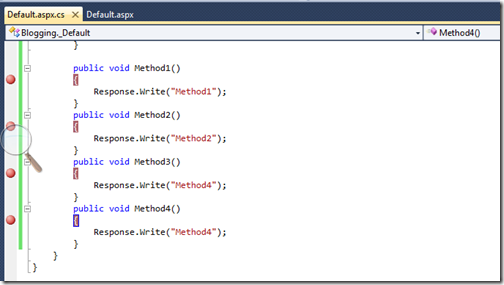
Now Let’s put four break point in visual studio like following.
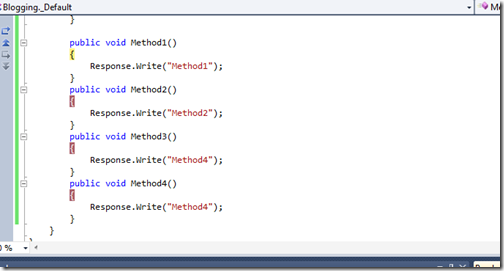
Now let’s debug the web application via pressing F5 and then we will go one by one break point and will add labels. Now I am at first break point.
Now when you go to the break point window you can see all the break point over there like following.

Now let’s Create a new label first for break point via selecting that row and right click edit label like following.

Once you click edit labels a window will appear which will ask for adding a new label for break point like following.

Now I am adding a new label called method1 label in this box.Now you can see the in break point window with a label just like following.

So now you can see the Method 1 Label is there so you need not to check this break point via clicking on that break point. You can remember this break point via clicking on this. That’s it. Hope you like it.. Stay tuned for more.. Happy Programming.

I have written following sample code to understand it better. This is a simple default.aspx page with four method to print a string on web page.
using System;
using System.Collections.Generic;
using System.Linq;
using System.Web;
using System.Web.UI;
using System.Web.UI.WebControls;

namespace Blogging
{
  public partial class _Default : System.Web.UI.Page
  {
      protected void Page_Load(object sender, EventArgs e)
      {
          Method1();
          Method2();
          Method3();
          Method4();

      }

      public void Method1()
      {
          Response.Write("Method1");
      }
      public void Method2()
      {
          Response.Write("Method2");
      }
      public void Method3()
      {
          Response.Write("Method4");
      }
      public void Method4()
      {
          Response.Write("Method4");
      }
  }
}
Here you can see there are four methods method 1,2,3 and 4 and each printing respective string with respective methods.
Now Let’s put four break point in visual studio like following.

Now let’s debug the web application via pressing F5 and then we will go one by one break point and will add labels. Now I am at first break point.

Now when you go to the break point window you can see all the break point over there like following.

Now let’s Create a new label first for break point via selecting that row and right click edit label like following.

Once you click edit labels a window will appear which will ask for adding a new label for break point like following.

Now I am adding a new label called method1 label in this box.Now you can see the in break point window with a label just like following.

So now you can see the Method 1 Label is there so you need not to check this break point via clicking on that break point. You can remember this break point via clicking on this. That’s it. Hope you like it.. Stay tuned for more.. Happy Programming.

![header_bootpage[1] header_bootpage[1]](https://blogger.googleusercontent.com/img/b/R29vZ2xl/AVvXsEhT4vqJvS6EbQ68RHSzX0vmKXh8Q-PO-f7uzTBUsc04ITbmsUCFIdmQyFqIQI3PkcAVhONfWxvcmVkRiyL6YJXUDj1i_jAT68SZdgwfQDwR7yicnVRD6YqyUAeNLdP3KTxnUP-t/?imgmax=800)
