In the first post I have explained how historical debugging will going to work and how we can enable the historical debugging. In this blog post I am going to take one real time scenario and then we will see the How historical debugging will work. Here I have selected the second option for Intellitrace - Track event and call Information. I am going to check historical debugging with my asp.net application so following is a simple code for that.

Now let’ proceed the things further now lets step in with the pressing F10 It will call ThrowHistoricalException and Here you can see the exception like following.

As You can see now the Exception thrown. Now lets move to IntelliTrace window what’s are information there.

As you can see whole event and method trace information here in Intellitrace windows. Also you can see the A reviwnd Icon there so on clicking on that you can got the specific events and restart debugging. Now I have clicked on Page_load event and Now its going to the page_load event statement where the exception is thrown. Just like below.

Also you can see there button given to move updown and other stuff to move your current point up and down. I have click move up and You can see in below image its moving up.

That’s it. As you can see its very easy to move up down and go back to location of code wherever you want with historical debugging. So now you can easily see what happens when your tester is reproducing the bugs. Hope you like it. Stay tuned for more.. Happy Programming.

using System;
using System.Collections.Generic;
using System.Linq;
using System.Web;
using System.Web.UI;
using System.Web.UI.WebControls;

namespace Blogging
{
 public partial class _Default : System.Web.UI.Page
 {
     protected void Page_Load(object sender, EventArgs e)
     {
         Response.Write("This is a page load event");
         ThrowHistoricalException();

     }
     public void ThrowHistoricalException()
     {
         throw new Exception("Historical Deubgging");
     }

 }
}
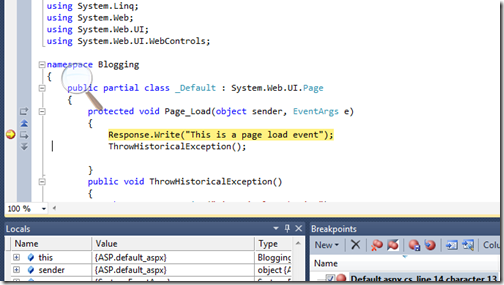
In above code you can see its very simple We are printing one statement on in page load event with Response.Write and then it will call a new method called ThrowHistoricalDebugging. Where it will throw a new exception. Now all ready to check let press F5 to debug this thing. I have putted the break point over Response.Write statement so We can trace everything. so now debugging starts at my break point Just like below

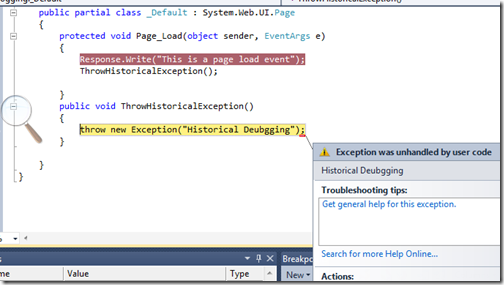
Now let’ proceed the things further now lets step in with the pressing F10 It will call ThrowHistoricalException and Here you can see the exception like following.

As You can see now the Exception thrown. Now lets move to IntelliTrace window what’s are information there.

As you can see whole event and method trace information here in Intellitrace windows. Also you can see the A reviwnd Icon there so on clicking on that you can got the specific events and restart debugging. Now I have clicked on Page_load event and Now its going to the page_load event statement where the exception is thrown. Just like below.

Also you can see there button given to move updown and other stuff to move your current point up and down. I have click move up and You can see in below image its moving up.

That’s it. As you can see its very easy to move up down and go back to location of code wherever you want with historical debugging. So now you can easily see what happens when your tester is reproducing the bugs. Hope you like it. Stay tuned for more.. Happy Programming.


0 comments:
Post a Comment
Your feedback is very important to me. Please provide your feedback via putting comments.